Contents
- 01Executive summary: seven key findings
- 02The robotics investment market
- 03Humanoid robots: shipments, leaders, commercialization
- 04Physical AI, general-purpose robots, and world models
- 05Vertical robotics and sector leaders
- 06Autonomous vehicles: moving toward commercial scale
- 07Investor exits: M&A, IPOs, and SPACs
- 08Public markets: testing business models against results
- 09Guidance for robotics founders
- 10Why large enterprises work with startups
- 11Four enterprise engagement models
- 12Mutual value and effective corporate pilots
- 13Structural trends and the industry outlook
- 14Principal risks and uncertainties
- 15Key industry participants and data sources
- 16Conclusion
01
Executive summary: seven key findings
Reporting convention: 2026 actual denotes investments recorded through approximately September 30, 2026; 2026 projection denotes a full-year estimate. Individual company statistics may be based on public statements and have not necessarily been independently audited. Rapid growth in fundraising does not, by itself, establish mature market demand or investment returns.
$50.7B
Investment surge
Approximately $50.7 billion had been recorded by the end of September; the full-year 2026 projection is $60.7 billion, nearly matching the combined 2022–2025 total.
41%
Highly concentrated funding
Megadeals are driving the increase. Waymo and Anduril raised a combined $21 billion, about 41% of the recorded nine-month amount.
25,000
Humanoids are moving into deliveries
An estimated 25,000 humanoid robots shipped in the first half of 2026, generating $740 million in revenue. Chinese manufacturers dominate unit volume.
Physical AI infrastructure is emerging
Developers of robotic foundation models and world models, not only hardware manufacturers, have raised rounds ranging from hundreds of millions to billions of dollars.
−21%
Public-market investors remain skeptical
The selected Western robotics stocks averaged −21%, compared with +19% for NASDAQ; the Chinese sample averaged −57% compared with −30% for HSTECH.
Investor exits lag deployment of capital
M&A is recovering and SPAC transactions are resurfacing, but these routes have not yet demonstrated liquidity on a scale comparable to recent private investment.
Large enterprises favor managed risk
Corporate buyers and investors emphasize strategic fit, measurable business value, execution, support, and an internal sponsor for a project.
02
The robotics investment market
Funding volume and trends, 2022–2026
- 2022$13.0B
- 2023$8.5B
- 2024$19.9B
- 2025$22.1B
- 2026$50.7B → $60.7B
| Year | Investment | Context |
|---|---|---|
| 2022 | $13.0B | Base year |
| 2023 | $8.5B | Down approximately 35% |
| 2024 | $19.9B | Up approximately 134% |
| 2025 | $22.1B | Up approximately 11% |
| 2026, Jan–Sep | $50.7B | Investment already recorded |
| 2026, projection | $60.7B | Includes an estimated $9.9B for the rest of the year |
Source: F/Prime, State of Robotics 2026. 2026 is a full-year projection, not finalized annual data. The cumulative 2022–2025 investment total is approximately $63.5B.
By geography, about $40.9 billion of recorded 2026 investments went to companies in the Americas and about $9.9 billion to Europe and Israel. This puts the Americas at approximately 80% of recorded funding. The figures differ slightly from the stated total because of rounding.
Investment by type of robotics
- $25.2B · 49.7%Vertical Robotics
- $18.7B · 36.9%Autonomous Vehicles
- $5.5B · 10.8%General Purpose Robotics
- $1.3B · 2.6%Enabling Systems
Vertical Robotics includes sector-specific systems in defense, logistics, manufacturing, healthcare, agriculture, construction, and mining. Autonomous Vehicles includes robotaxis, self-driving trucks, and road-going delivery systems. General Purpose Robotics covers humanoids and general-purpose robotics foundation models. Enabling Systems comprises sensors, LiDAR, supporting hardware, software components, and other autonomy-enabling technologies.
Source: F/Prime, State of Robotics 2026. Segment shares are calculated from the rounded $50.7B January–September total.
Megarounds and capital concentration
- 84%Rounds above $250M, incl. Waymo and Anduril
- 16%All smaller rounds
| Round size | 2026 capital | Deal count |
|---|---|---|
| More than $250M, excluding Waymo and Anduril | $21.6B | 25 |
| Waymo | $16.0B | 1 |
| Anduril | $5.0B | 1 |
| $50M–$250M | $5.4B | 48 |
| $15M–$50M | $1.7B | 63 |
| $2.5M–$15M | $1.1B | 154 |
Together, rounds above $250 million, including Waymo and Anduril, accounted for roughly 84% of the total investment recorded. This concentration means that record fundraising totals do not imply similarly favorable funding conditions for every robotics startup.
Additional notable rounds include Mod Robotics ($500M, Series A), Maven Robotics ($100M, Series A), Enigma ($71M, seed), micro1 ($53M, seed), and Atoms ($1.7B). These are individual exceptional deals, not a benchmark for median early-stage funding.
Source: F/Prime, State of Robotics 2026. The deal-size analysis excludes rounds below $2.5M.
03
Humanoid robots: shipments, leaders, commercialization
First-half 2026 performance
~25,000
Humanoids shipped, H1 2026
+432% year on year
$740M
Revenue, H1 2026
+323% year on year
~$29,600
Implied revenue per unit
Calculated estimate
The last figure divides aggregate industry revenue by estimated shipments. It is not a retail price for a specific model, a resale valuation, or necessarily the price of a full-size humanoid. The industry estimates cited here draw on IDC and Forbes data as reported in the F/Prime research.
Leading manufacturers by shipment volume
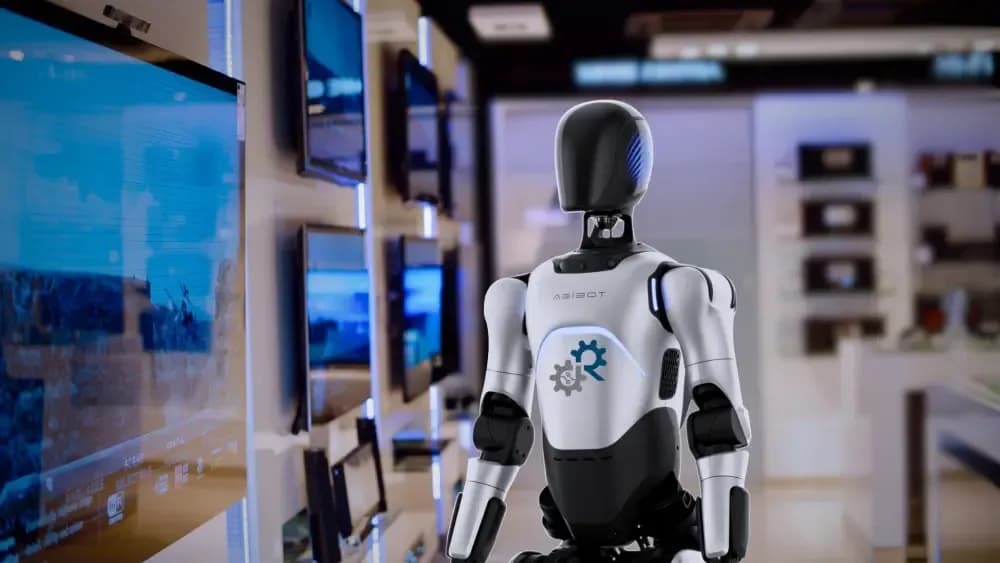
- AGIBOT8,600+
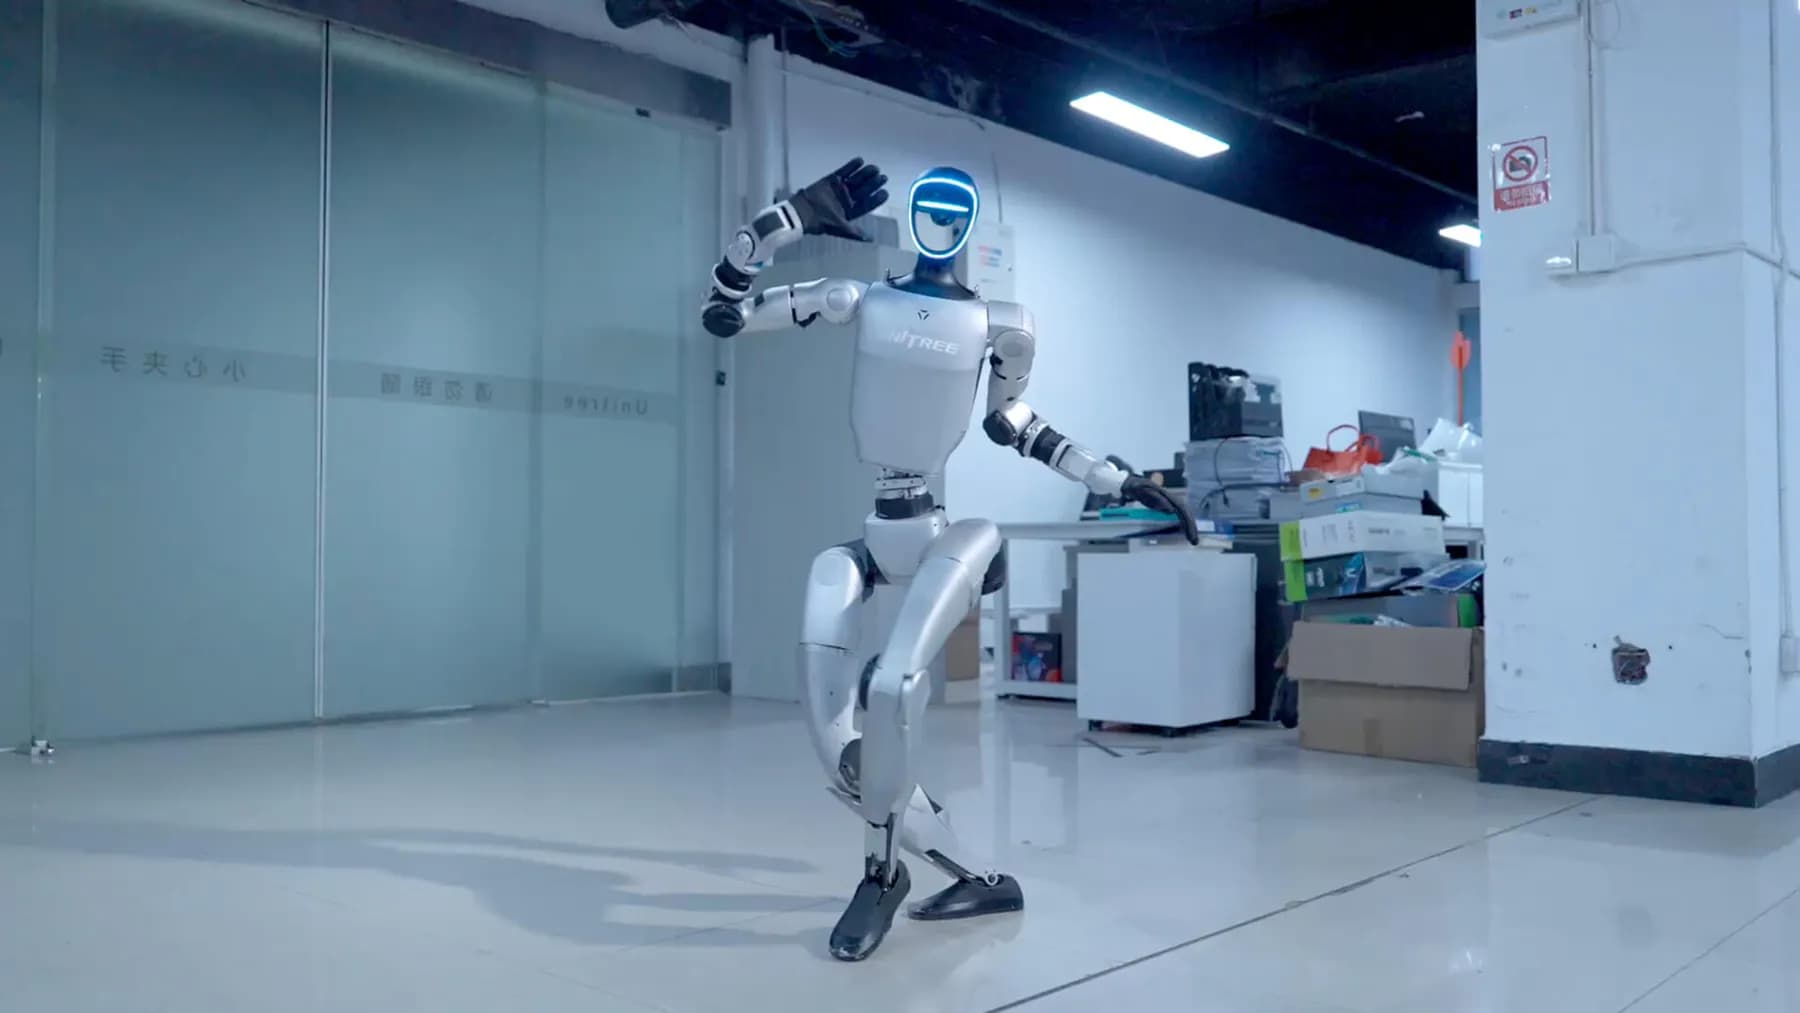
- Unitree~5,000
- Booster Robotics~1,000
- UBTECH~900
- Leju Robot~460
Galbot, Astribot, Fourier and Galaxea shipped lower volumes than the manufacturers listed above. Chinese manufacturers account for the largest share of shipped units. The products covered vary in form factor, configuration, and commercial purpose, making simple average price comparisons misleading.
The shift toward enterprise deployments
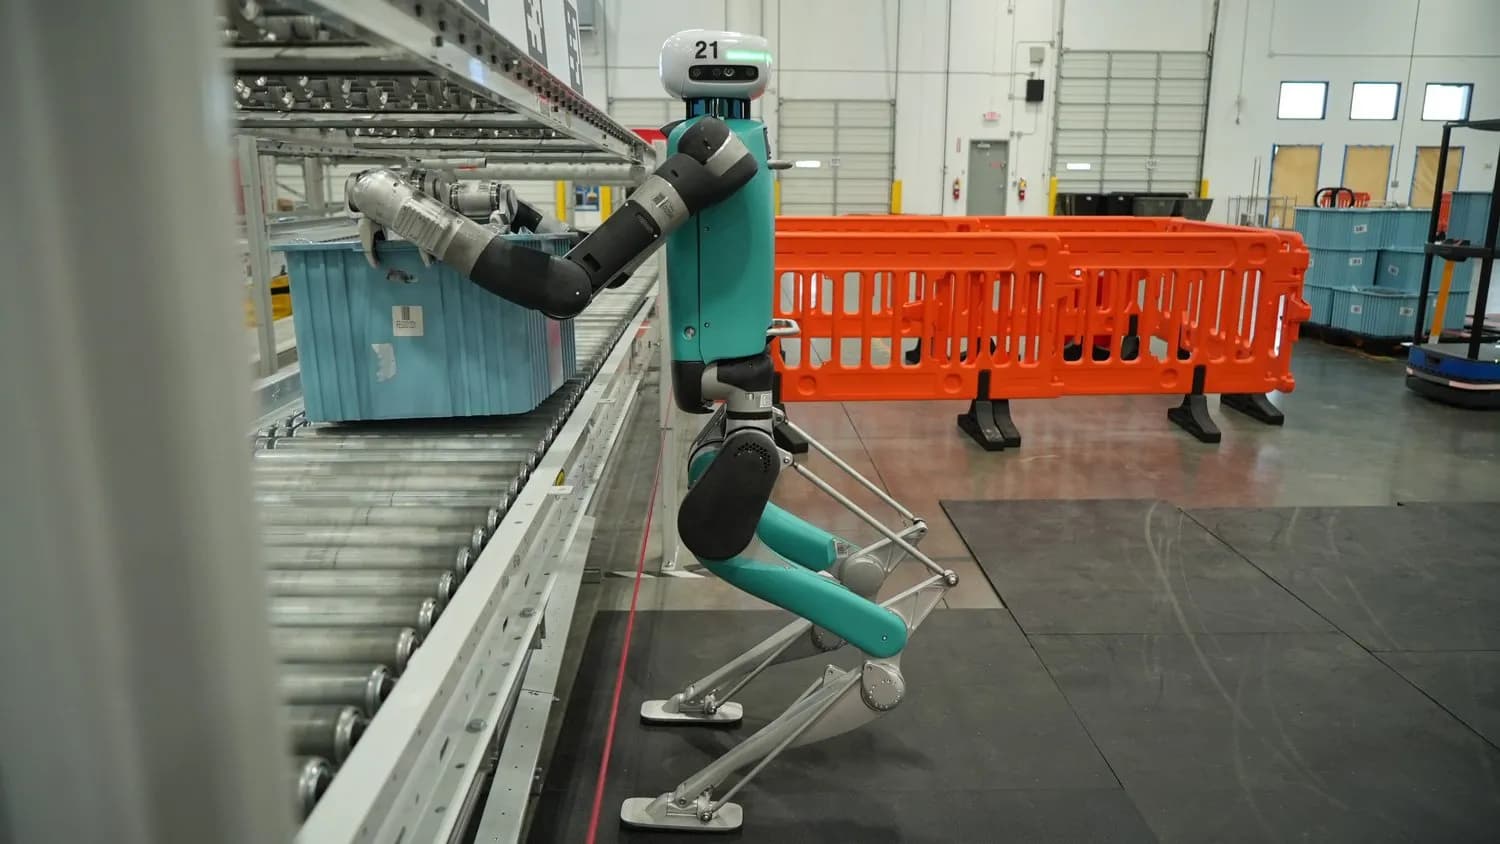
- Agility Robotics and Toyota Motor Manufacturing Canada. A commercial agreement was announced following a pilot deployment of Digit robots.
- Agility Robotics and Churchill XI. Approximately $300M in conditional orders was announced, involving more than 1,000 robots. Conditional orders are not realized revenue.
- Humanoid and Schaeffler. An agreement was announced that could lead to deployment of thousands of humanoid robots.
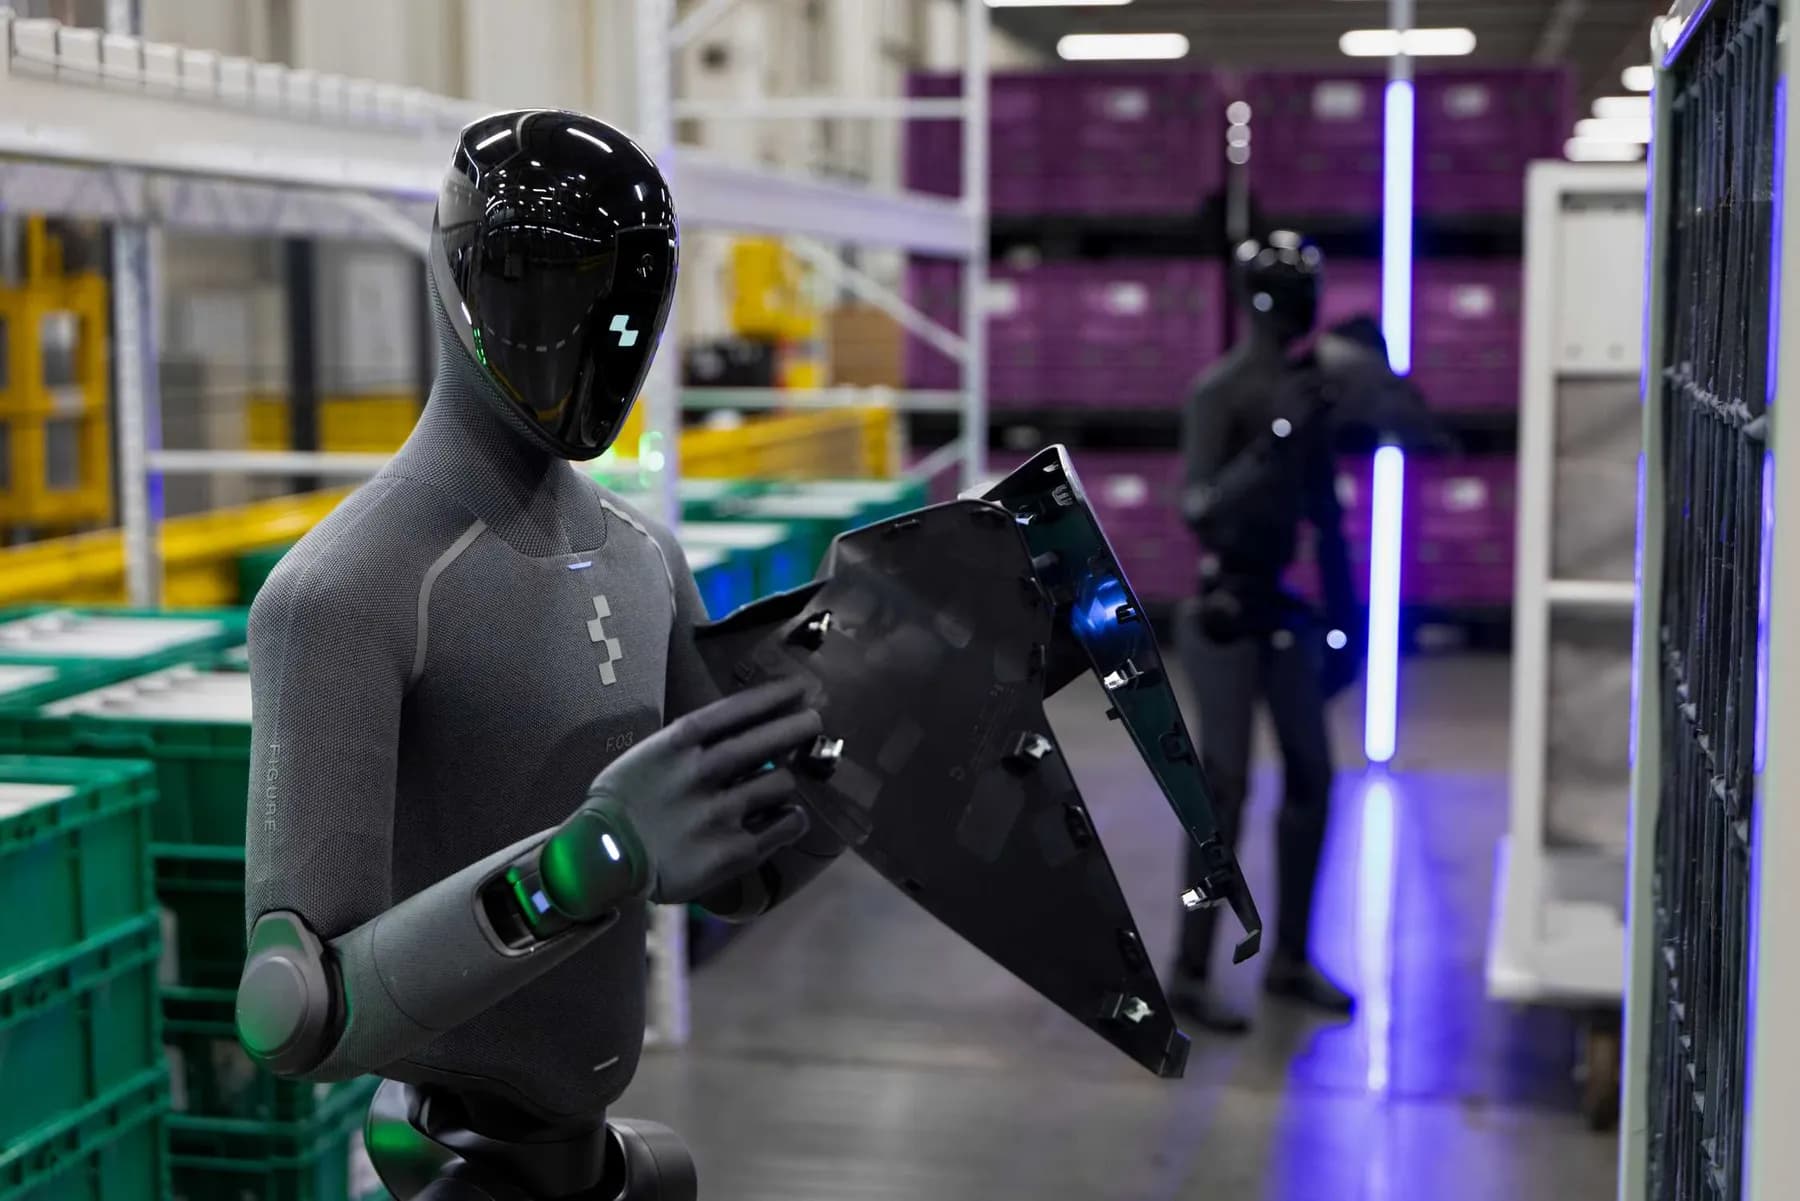
- Figure and Catalyst Brands. The companies announced a collaboration intended to scale humanoid robot operations.
Source: F/Prime, State of Robotics 2026. Agreements, pilots, conditional orders, and completed shipments represent different levels of commercial commitment.
04
Physical AI, general-purpose robots, and world models
Growth in General Purpose Robotics
- 2022$0.2B
- 2023$0.3B
- 2024$2.0B
- 2025$6.2B
- 2026$5.5B → $7.3B
Venture capital is being directed not only toward robotic hardware but also toward reusable approaches to robot control, learning from interaction, and models that represent physical environments.
Major rounds in 2026
| Company | Round | Focus |
|---|---|---|
| NEURA Robotics | $1.4B | Humanoids |
| Skild AI | $1.4B | Robotics Foundation Models |
| Physical Intelligence | $1.0B | Robotics Foundation Models |
| FieldAI | $700M | Robotics Foundation Models |
| Generalist AI | $600M | Robotics Foundation Models |
| Walden Robotics | $302M | Humanoids |
| Sunday Robotics | $165M | Humanoids |
| Humanoid | $152M | Humanoids |
| Maven Robotics | $100M | Humanoids |
Source: F/Prime, State of Robotics 2026. Figures represent individual funding rounds, not company market capitalizations.
World models and spatial intelligence
| Company | Amount | Specialization |
|---|---|---|
| World Labs | $8.2B acquisition | Spatial intelligence and 3D models |
| Advanced Machine Intelligence | $1B raised | Models of physical environments using sensor data |
| General Intuition | $674M raised | Real-world learning in interactive environments |
| Decart | $453M raised | Interactive generative environments |
| Odyssey | $338M raised | Causal, multimodal world simulations |
| Embo | $100M* | Perception and navigation |
| Veeda AI | $90M | Physical-world simulations |
| Dream Labs | $90M* | World Action Models |
| Moonlake | $28M | Simulation and game generation |
Reported collaborations include Odyssey with Flexion; Moonlake with Dexmate, Anvil, and YAM; and Google Gemini with Apptronik, Boston Dynamics, Agile Robots, Sharpa, Inspire, Franka, Robotiq, and Agility. The World Labs figure refers to an AMD acquisition transaction, not a venture financing round.
Source: F/Prime, State of Robotics 2026. *The indicated amounts were described as reported but not yet confirmed.
Layers of the emerging technology ecosystem
Interconnected technology layers are taking shape: hardware platforms, general-purpose AI control models, simulation environments, and deployment and fleet-management systems. The quality of a working solution depends on the reliability and interoperability of the entire stack, not just the performance of an individual AI model.
As the ecosystem becomes more diverse, integration standards, safe system behavior, heterogeneous fleet support, and the portability of operational processes across hardware platforms become increasingly significant.
05
Vertical robotics and sector leaders
Investment allocation
- Defense$16.0B
- Other$4.5B
- Manufacturing$3.3B
- Logistics$1.4B
Defense accounts for nearly 64% of investment in Vertical Robotics. Manufacturing investment, meanwhile, rose from $0.9 billion in 2025 to approximately $3.3 billion during the first nine months of 2026. Drivers include reindustrialization, data-center construction, defense procurement, and the modernization of productive capacity.
Largest investment rounds in 2026
| Company | Sector | Amount |
|---|---|---|
| Anduril Industries | Defense | $5.0B |
| Helsing | Defense | $1.8B |
| Saronic Technologies | Defense | $1.75B |
| Hadrian | Manufacturing | $1.73B |
| Atoms | Other | $1.7B |
| Shield AI | Defense | $1.5B |
| Quantum Systems | Defense | $1.2B |
| Mind Robotics | Manufacturing | $900M across 2 rounds |
| Zipline | Logistics | $600M |
| STARK | Defense | $578M |
| Cambridge Aerospace | Defense | $498M |
| ROARK | Defense | $313M |
| Bedrock Robotics | Construction & Mining | $270M |
| Cellares | Lab/Pharma | $257M |
| Neros | Defense | $250M |
Hadrian, Mind Robotics, Bedrock Robotics, and Cellares illustrate the breadth of investment in manufacturing and real-world operating environments, beyond the most visible humanoid and foundation-model announcements.
Source: F/Prime, State of Robotics 2026.
06
Autonomous vehicles: moving toward commercial scale
Investment by year
- 2022$4.1B
- 2023$2.2B
- 2024$8.4B
- 2025$0.9B
- 2026, recorded$18.7B
Of the $18.7 billion recorded in 2026, $16 billion was attributable to Waymo. This exceptionally high concentration makes it inappropriate to extrapolate the category’s headline funding growth to every participant in autonomous transportation or robotics.
Leading companies and commercial progress
| Company | Funding shown | Commercial progress |
|---|---|---|
| Waymo | $27B | Paid driverless rides in 15 US cities; over 500,000 rides per week; more than 4,000 vehicles |
| Wayve | $2.5B | Pre-commercial Uber robotaxi trials planned in London |
| Waabi | $1.0B | Autonomous trucking with Volvo; Uber robotaxi agreement |
| May Mobility | $421M | Paid services at three US sites; more than 550,000 rides to date |
| Tesla | Corporate | Robotaxi operations reported in six cities and more than 1M unsupervised miles |
| Zoox | Corporate | Paid Las Vegas rides since August 2026; approximately 1M rides and 3M autonomous miles |
Large autonomous fleets require dependable remote monitoring, maintenance, safety management, and tight control over the unit economics of each operation. Operational traction must be distinguished from returns on venture capital invested.
Source: F/Prime, State of Robotics 2026. Operating metrics reflect public company disclosures and F/Prime analysis.
07
Investor exits: M&A, IPOs, and SPACs
Acquisitions
| Transaction size | Number, 2022–2026 |
|---|---|
| $25M–$250M | 15 |
| $250M–$500M | 7 |
| $500M–$1B | 10 |
| Total | 32 |
| Acquired company | Acquirer | Amount |
|---|---|---|
| DroneDeploy | Procore | $845M |
| DZYNE | Ondas | $876M |
| Mentee Robotics | Mobileye | $900M |
Acquisition activity has gradually recovered, but aggregate exit value remains far below the venture capital deployed in recent years. Large private financing rounds should not be treated as evidence of eventual liquidity or investment returns.
Renewed interest in SPACs
| Company | Announced transaction or valuation |
|---|---|
| FORT Robotics | Announced SPAC transaction |
| May Mobility | SPAC plan at approximately $1.4B enterprise value |
| Agility Robotics | Reported SPAC transaction at approximately $2.5B valuation |
| Einride | SPAC plan at approximately $1.8B valuation |
| PlusAI | Abandoned planned SPAC listing |
An announced SPAC agreement or headline valuation does not establish that a transaction has closed or that public shares trade at the indicated valuation. The return of SPAC structures is presented as a potential warning sign of speculative market conditions.
Source: F/Prime, State of Robotics 2026.
08
Public markets: testing business models against results
Listed robotics companies in Western markets
- AutoStore+77%
- Ouster+49%
- Aurora+3%
- Aeva−3%
- Intuitive Surgical−9%
- Symbotic−22%
- Red Cat−38%
- PROCEPT BioRobotics−49%
- AeroVironment−55%
- Serve Robotics−60%
- Kodiak−72%
- Einride *−75%
* since IPO
| Company | Market cap | Revenue growth | Stock return |
|---|---|---|---|
| Intuitive Surgical | $144B | +21% | −9% |
| Symbotic | $25.4B | +21% | −22% |
| Aurora | $11.1B | +400% | +3% |
| AeroVironment | $7.2B | +84% | −55% |
| AutoStore | $5.4B | +28% | +77% |
| Ouster | $2.9B | +63% | +49% |
| PROCEPT BioRobotics | $1.0B | +23% | −49% |
| Red Cat | $987M | +867% | −38% |
| Aeva | $979M | +56% | −3% |
| Einride | $559M | +15% | −75%* |
| Serve Robotics | $403M | +426% | −60% |
| Kodiak | $385M | −56% | −72% |
The Western sample registered 42% median revenue growth, a 10.8x median EV/LTM revenue multiple, and an average stock return of −21%, versus +19% for NASDAQ, a gap of roughly 40 percentage points.
Profitability varies considerably: reported EBITDA margins include 38% for Intuitive Surgical, 34% for AutoStore, and 2% for Symbotic. Illustrative EV/LTM revenue multiples include 12.6x for Intuitive Surgical, 9.0x for Symbotic, 7.9x for AutoStore, 13.0x for Ouster, and 41.8x for Aeva. Several younger companies have negative EBITDA.
Source: F/Prime, State of Robotics 2026. Market capitalizations as of September 30, 2026. *Where applicable, stock performance is measured since IPO rather than over a full 12 months.
Listed Chinese robotics and autonomy companies
- Roborock−40%
- Hesai−43%
- WeRide−46%
- Unitree *−47%
- Yunji Technology *−50%
- Ecovacs−51%
- UBTECH−52%
- Horizon Robotics−57%
- RoboSense−61%
- Pony.ai−71%
- Geek+−75%
- Seyond *−88%
* since IPO
| Company | Market cap | Revenue growth | Stock return |
|---|---|---|---|
| Unitree | $27.2B | +1,262% | −47%* |
| Horizon Robotics | $8.5B | +50% | −57% |
| UBTECH | $4.8B | +94% | −52% |
| Roborock | $4.5B | +43% | −40% |
| Ecovacs | $4.3B | +20% | −51% |
| Pony.ai | $2.8B | +46% | −71% |
| Hesai | $2.5B | +41% | −43% |
| WeRide | $1.7B | +113% | −46% |
| Geek+ | $1.2B | +36% | −75% |
| RoboSense | $1.0B | +35% | −61% |
| Yunji Technology | $531M | +39% | −50%* |
| Seyond | $277M | +92% | −88%* |
The Chinese sample posted 44% median revenue growth, a 5.7x median EV/LTM revenue multiple, and −57% average stock performance, compared with −30% for HSTECH.
Positive EBITDA margins are shown for Unitree (31%), Roborock (9%), Ecovacs (11%), and Hesai (3%), while several peers remain loss-making. Unitree is reported at 86.8x EV/LTM revenue on $306 million of trailing revenue, indicating a substantial premium for expected future growth.
Source: F/Prime, State of Robotics 2026. *Stock returns for recent listings are measured from IPO.
Comparing the public-market samples
| Metric | Western sample | Chinese sample |
|---|---|---|
| Median revenue growth | 42% | 44% |
| Median EV / revenue | 10.8x | 5.7x |
| Average stock return | −21% | −57% |
| Reference index | NASDAQ +19% | HSTECH −30% |
The samples are not perfectly comparable in geography, business models, liquidity, or index composition. Nevertheless, the results underscore the disconnect that can arise between rapid revenue growth, expectations embedded in valuation multiples, and actual shareholder returns.
09
Guidance for robotics founders
Current market conditions present a combination of fundamental technical progress, generous funding for selected teams, and a more demanding reality for commercial execution and eventual exits.
Team, technology, and traction
World-class strength in one, and preferably two, of these three dimensions can support extraordinary fundraising opportunities. For founders who have not yet demonstrated a clear advantage, the capital-raising environment is considerably harder.
Revenue is the gravity of startups
Over time, company valuations are tested by real customer demand and sustainable economics. Some businesses will fail to meet current expectations, leading to down rounds, consolidation, or closure; others will develop attractive and lasting market positions.
Past performance does not guarantee future results
Technological progress in robotics is real, but the timing of adoption, viable business models, and the identity of long-term winners remain uncertain. A small number of prominent success stories does not imply that every robotics subsector will develop at the same pace.
Source: F/Prime, State of Robotics 2026.
10
Why large enterprises work with startups
Enterprises partner with startups to access innovation, shorten learning cycles, and create strategic options without carrying the full cost and risk of internal development.
| Enterprise motivation | Value a startup can provide |
|---|---|
| Faster access to innovation | Speed and technology not readily available from internal teams |
| Lower-cost exploration | Tests of new technologies, markets, or business models |
| Connection to emerging markets | Early insight into new customers, needs, and ecosystems |
| Specialized capabilities | Distinct technology, expertise, or intellectual property |
| Strategic optionality | Ability to buy, invest, co-develop, partner, or learn |
| Cultural stimulus | New perspectives and challenges to established practices |
| Talent and networks | Entrepreneurial expertise and relevant industry connections |
What enterprises care about most
- Strategic fit: a clear contribution to an existing business priority.
- Risk reduction: credible control of technical, operational, and reputational risks.
- Governance: clarity about the decision-maker, budget owner, and accountability for implementation.
- Delivery capability: evidence that the startup can scale, support its product, and follow through.
- Internal champion: an employee willing to advocate for the initiative across departments.
A startup should explain its differentiation and why it matters now, propose a bounded pilot, clarify the expertise it brings, and demonstrate credible customer insight rather than relying on a technology narrative alone.
Source: Analog Devices, enterprise-startup collaboration guidance.
11
Four enterprise engagement models
01
Customer
The enterprise purchases the product, pays for a pilot, or uses the service.
02
Investor
The enterprise provides capital to the startup.
03
Joint Development
The parties co-develop and technically validate a solution.
04
Partnership
Distribution, integration, co-marketing, or another commercial partnership.
The enterprise as a customer
| Consideration | Details |
|---|---|
| Benefits | Commercial validation, revenue, a flagship reference account, product feedback, and credibility |
| Challenges | Long procurement cycles, legal and compliance requirements, support obligations, and over-customization risk |
| Enterprise priorities | A real business problem, reliability, responsive support, security, compliance, continuity, clear ROI, and low adoption risk |
The enterprise as an investor
| Consideration | Details |
|---|---|
| Benefits | Capital, strategic credibility, potential access to customers and channels, experts, and positive market signaling |
| Challenges | Misaligned expectations, slower decisions, concerns among other partners, and limitations on strategic flexibility |
| Enterprise priorities | Future strategic relevance, team quality, differentiated technology, execution risk, and collaboration options |
Joint development and partnerships can distribute technical risk, combine complementary expertise, and expand commercial reach. Intellectual property, data-sharing rights, exclusivity, and the boundaries of each party’s obligations should be agreed upon explicitly.
12
Mutual value and effective corporate pilots
| What a startup needs | What a large enterprise needs |
|---|---|
| Speed and proof of value | A time-bounded, lower-risk experiment |
| Product feedback and market access | A solution to a real operational problem |
| Access to decision-makers | Technical credibility and dependable support |
| Revenue and a flagship customer | Evidence the startup can deliver before scaling broadly |
Principles for successful cooperation
- Understand how decisions are made and who makes them; few large organizations have a single universal decision-maker.
- Demonstrate how the offering advances a current corporate strategy.
- Identify and support an internal champion who can coordinate the collaboration.
- Clarify risk tolerance, expected commercial outcomes, and the time horizon for results.
- Recognize that every initiative competes with other programs for internal budget.
- Define what the startup itself needs from the partnership and consider opportunity costs.
13
Structural trends and the industry outlook
Five developments worth monitoring
- 01Humanoid commercialization. Track actual installed fleets, utilization hours, repeat orders, successful task completion rates, and service costs, not just announced contracts.
- 02Economics of vertical applications. In defense, manufacturing, logistics, medicine, and mining, measurable task-level productivity and payback will be central.
- 03Physical AI and world models. The key open question is how reliably models can transfer skills across tasks, environments, and hardware at an economically viable training cost.
- 04Scaling operations. Growing robot fleets increase requirements for reliability, safety, software updates, integration, and after-sales support.
- 05From expectations to financial results. Revenue, gross margins, capital intensity, burn rate, and verified operational results will matter more than isolated demos.
Metrics for evaluating genuine progress
| Category | Key indicators |
|---|---|
| Shipments | Units sold and deployed, repeat orders, composition of installed fleets |
| Operations | Productive hours, autonomous operation, reliability, maintenance and downtime costs |
| Commercialization | Deployment revenue, B2B retention, returns from pilot-to-rollout conversion |
| Economics | Gross margin, training/inference costs, cost of capital |
| Funding and exits | Round concentration, M&A, completed IPOs and SPAC transactions |
These metrics help distinguish a technical demonstration from a repeatable commercial model. Letters of intent, conditional purchase orders, completed shipments, and recognized revenue should not be conflated.
14
Principal risks and uncertainties
| Risk | Why it matters | Indicators to track |
|---|---|---|
| Overextended valuations | A large funding round does not establish profitability or demand | Revenue, margins, listed-company valuation multiples |
| Concentrated investment | A few megadeals distort headline totals | Share of funding in large rounds; median deal size |
| Long adoption cycles | Pilots do not always convert into repeatable contracts | Repeat purchase orders, deployment timelines |
| Technical reliability | Downtime and difficult environments undermine economics | Failures, service costs, safety performance |
| Regulation and security | Liability, certification, and cyber risks can slow adoption | Standards compliance, incident disclosures |
| Limited investor liquidity | A thin exit market can impede future fundraising | Completed M&A/IPOs, post-listing returns |
The robotics sector combines fundamental technological progress with uncertainty about winners, adoption timelines, and profitable business models. Rigorous analysis therefore requires both engineering and financial evidence.
15
Key industry participants and data sources
F/Prime Capital
F/Prime Capital invests in healthcare and technology companies. Its portfolio includes more than 370 companies globally, including 23 businesses it helped create. Robotics-related portfolio names include EKA, Burro, Teleo, Unbox Robotics, RightHand Robotics, Seyond, and Cartesian Kinetics.
State of Robotics: Sanjay Aggarwal (Venture Partner) and Betsy Mulé (Principal). Research contact: [email protected]
Industry datasets
Market data sources include F/Prime Capital, PitchBook, S&P Capital IQ, Yahoo Finance, IDC, Forbes, and public company disclosures. Full-year 2026 projections are distinguished from investments already recorded.
Enterprise partnerships
Analog Devices identifies four main modes of engagement: Customer, Investor, Joint Development, and Partnerships. Common success factors include strategic alignment, risk control, demonstrable commercial value, and execution reliability.
16
Conclusion
Robotics in 2026 is defined by accelerating investment and the development of several related markets: general-purpose robots, vertical automation, autonomous transportation, and Physical AI software platforms. The sector remains highly uneven. Alongside rapidly expanding companies, many ventures have not yet demonstrated durable revenues or sustainable unit economics.
The defining financial feature of the year is the concentration of capital in a small number of exceptional funding rounds. This intensifies competition for talent, manufacturing capacity, and computing resources without guaranteeing easy access to investment for the broader startup ecosystem.
Humanoid shipment estimates and emerging enterprise contracts point to genuine movement toward deployment. The next phase will depend on operational reliability, lower total cost of ownership, available service infrastructure, and the ability to convert pilots into repeatable commercial deployments.
For startups and large enterprises alike, successful collaboration calls for execution discipline: clearly defined business objectives, bounded pilots, agreed success criteria, managed risks, and an understanding of enterprise decision-making.